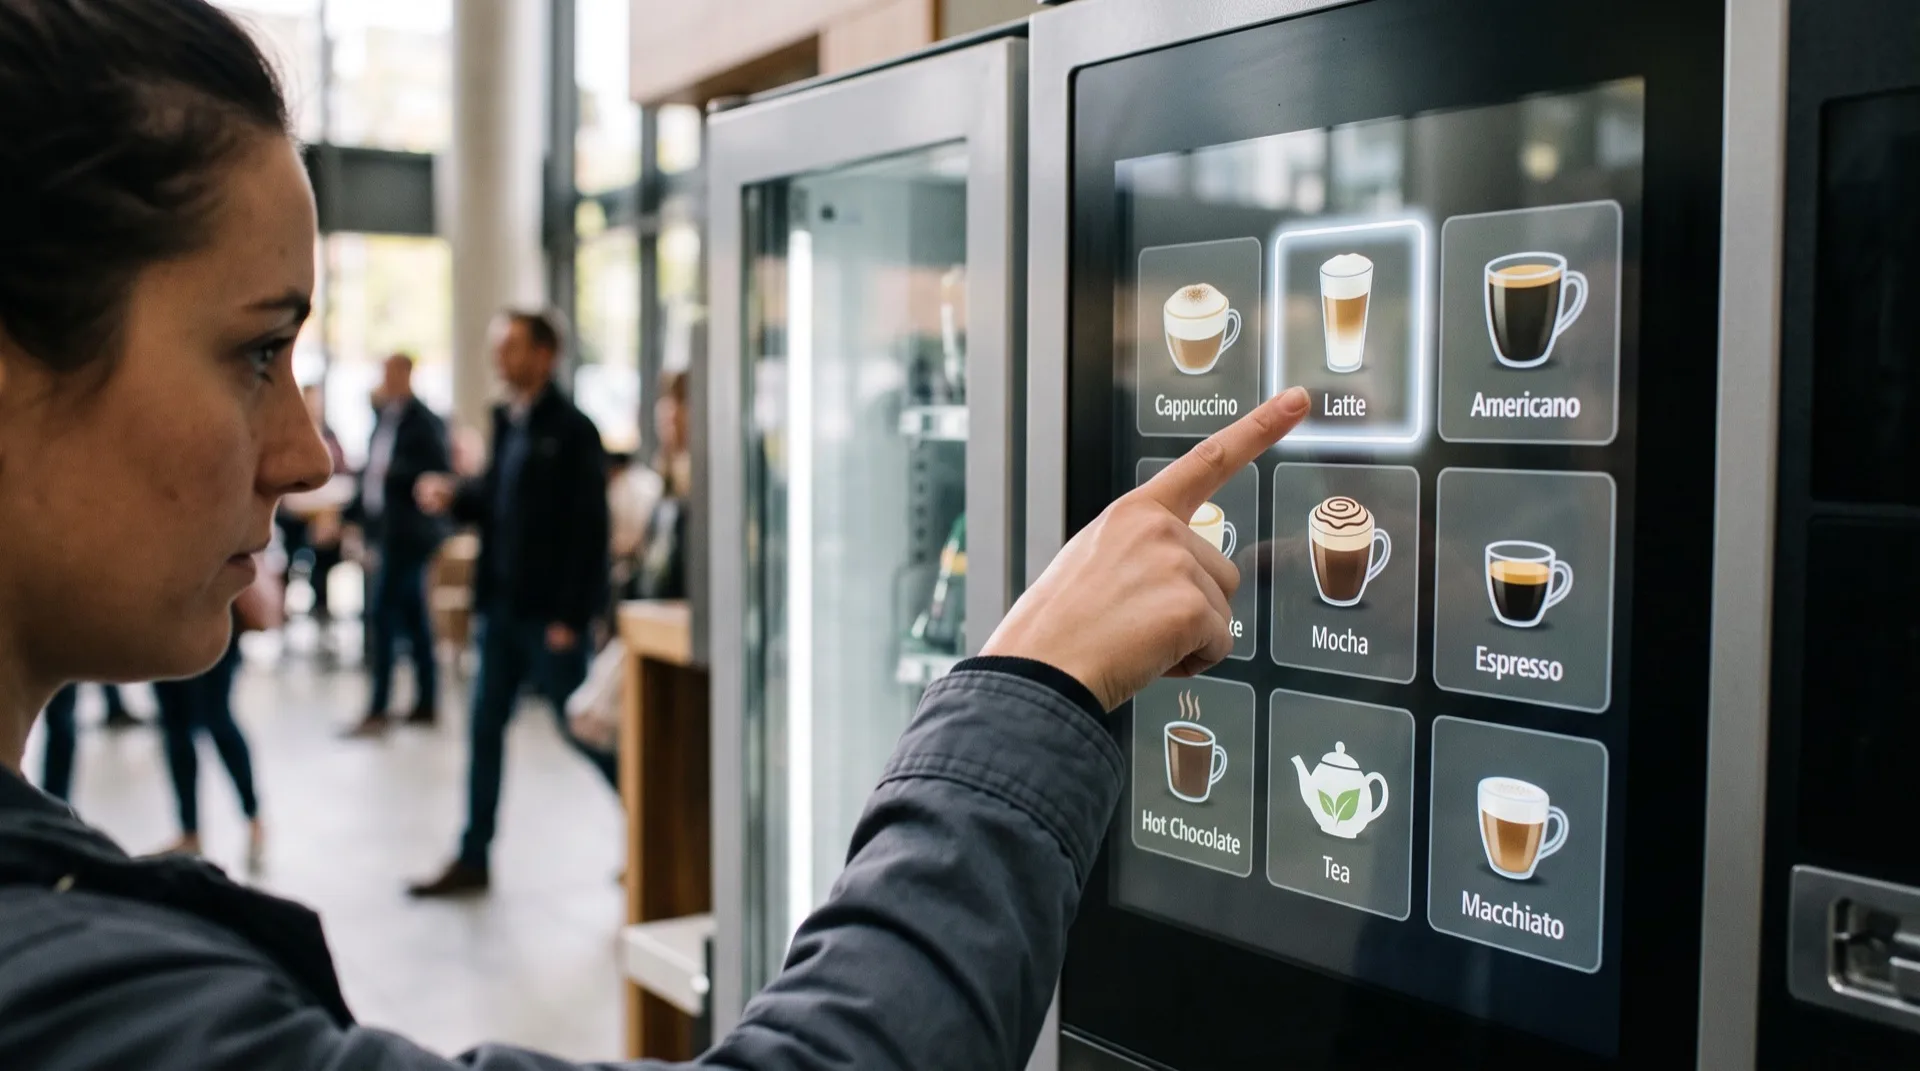

How much a coffee vending machine earns per month comes down to one short formula: cups sold per day, multiplied by the price per cup, multiplied by the number of selling days. Everything else, from the cost of the cup itself to electricity, water, rent share and service, is subtracted from that turnover. On a typical location with 30–60 cups a day at 80–120 per cup, monthly revenue lands around 90,000. That is the headline number. The useful part is understanding which levers move it up or down, and how a machine pays for itself over time.
The coffee vending machine profit formula in plain terms
Turnover is the easy half. You take the number of cups poured on an average day, multiply by the sale price, then multiply by the days the location is actually open. A machine in an office that runs Monday to Friday has a different monthly total than one in a hospital corridor working every day, even if the daily cup count looks similar.
Profit is turnover minus costs. There are three cost layers worth tracking separately:
- Cost per cup: coffee, tea, chocolate powder, sugar, milk if used, and the cup itself. In the CoffeeVar model this is 12–20 per cup, which is the single most important number to know before you set a price.
- Operating costs: electricity, water, and any rent share or commission paid to the location owner. These are largely fixed, so they hurt more when volume is low and matter less as cups per day rise.
- Service and consumables: cleaning, descaling, spare parts, refilling trips and technical support. Remote monitoring reduces unnecessary visits, but it does not remove them entirely.
The gap between 80–120 and 12–20 is your gross margin per cup. Multiply that by daily cups and you have a rough daily contribution before fixed costs. That is the number that decides whether a location is worth keeping.
Low, medium and high traffic: three realistic scenarios
Traffic is the variable that changes everything. The same machine, the same menu and the same price can look like a hobby in one place and a solid side income in another. The table below compares the three traffic bands using the standard CoffeeVar figures, so you can see how the same cost per cup behaves at different volumes.
| Scenario | Daily cups | Price per cup | Monthly turnover | What drives the result |
|---|---|---|---|---|
| Low traffic | Below 30–60 | 80–120 | Well under 90,000 | Fixed costs dominate; the site may not justify a machine |
| Medium traffic | Around 30–60 | 80–120 | Roughly 90,000 | Cost per cup of 12–20 leaves a healthy margin |
| High traffic | Clearly above 30–60 | 80–120 | Comfortably above 90,000 | Fixed costs spread thin; each extra cup is nearly pure margin |
Read the table as a shape, not a promise. Low traffic is where most disappointing installations live: the machine works, people like it, but there are simply not enough of them walking past. Medium traffic is the zone where a machine earns its place and pays back on schedule. High traffic is where the same equipment becomes a genuine revenue line, because electricity, water and the rent share are already covered by the first cups of the day.
One practical note on payment. Locations where people carry small change behave differently from locations where they tap a card or scan a QR code. Offering coins, tokens, banknotes, cards and contactless on the same unit removes the “I have no cash” objection, which is often the real reason a low traffic site stays low. A coin operated tea and coffee vending machine still works well in some settings, but mixed payment options protect your volume.
Payback: when the machine stops costing and starts earning
Payback is simply the purchase price divided by the monthly profit the machine generates. With the standard figures, a machine at typical traffic reaches payback in 6–12. Two things shorten that period: more cups per day, and a better margin per cup. Two things stretch it: downtime and underpricing.
If you would rather not carry the upfront cost at all, rental as a location partnership flips the model. CoffeeVar installs and operates the machine, the location invests nothing, and the location receives 20% of sales, which works out to about 18,000 per month at typical traffic. Sales are visible online, so the split is never a matter of trust. You can read the details on the sale and rental page.
What actually raises revenue
Most operators chase new locations when they should first squeeze more out of the existing one. Four levers do most of the work:
Menu breadth. A machine that only pours coffee serves coffee drinkers. Add tea and hot chocolate and you serve the whole building, including the people who do not drink coffee at all. The tea and coffee vending machine range covers this directly.
Recipe count. More recipes mean more reasons to press a button. A machine running a wider menu gives regulars something to rotate through instead of the same drink every day.
Price discipline. Raising the price from a low figure to 80–120 often changes very little in daily volume but a great deal in monthly profit, because the cost per cup of 12–20 stays fixed. Test it once and watch the cup count for two weeks.
Placement. The same machine earns differently at the entrance, in a canteen, on a factory floor or in a waiting area. Foot traffic, dwell time and the distance to the nearest alternative all matter more than the machine’s specification. If a site underperforms, moving it ten metres can outperform any menu change.
How the calculator page helps you decide
Guessing is the most expensive part of this business. The coffee vending machine calculator lets you enter your own cup count, your price and your cost assumptions, and see turnover, monthly profit and payback before you commit to anything. It is the fastest way to test whether a location is a medium traffic site or a low traffic site in disguise, and whether buying or renting suits your situation better.
If you want to compare configurations, capacity options and payment setups side by side, the coffee machine catalog is the place to start. For pricing on a specific unit, see the coffee machine prices page.
Conclusion
Coffee vending machine profit is not a mystery, it is arithmetic. Cups per day times price gives turnover. Subtract 12–20 per cup plus electricity, water, rent share and service, and you have monthly profit. At typical traffic that is around 90,000, with payback in 6–12. The operators who do well are rarely the ones with the most machines. They are the ones who measured the location first, priced properly, and gave people more than one reason to press a button.
Start with the numbers for your own site, then talk to us about which setup fits. You can reach the team through the contact page.